|
This is a catalog of
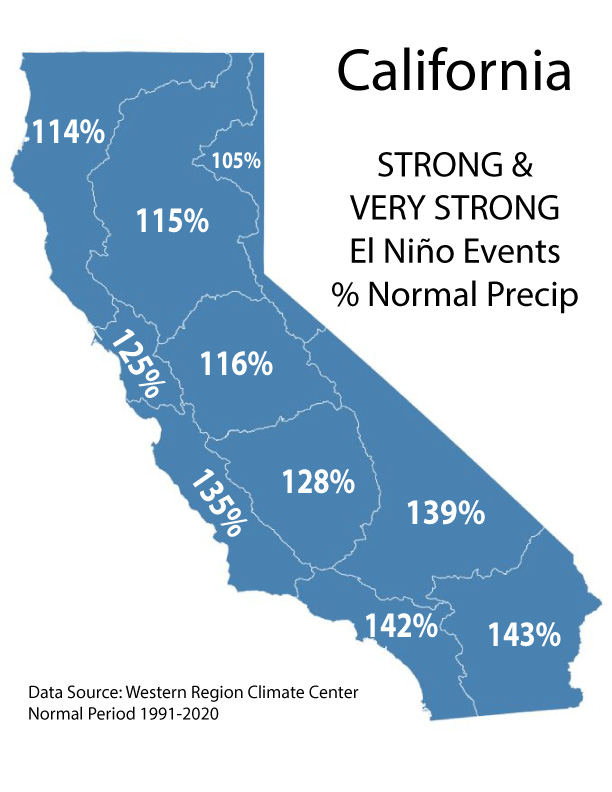
California precipitation anomalies for
previous "Strong" and "Very Strong" El Niño events based upon their strength and the
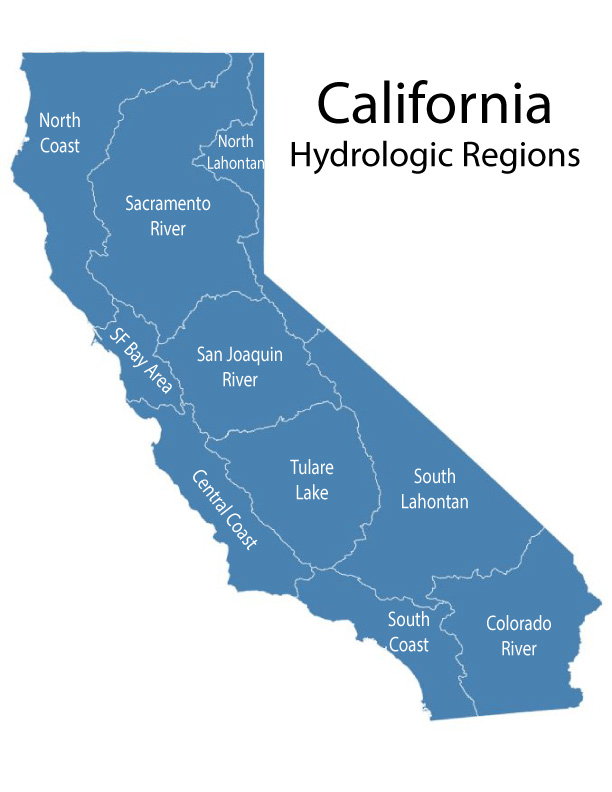
10 state hydrologic regions. It has the average for
both categories of events and the wide range
of the individual seasons that went into making up each of the averages.
It
cannot be stressed strongly enough that this is a climatological analysis
and NOT a forecasting tool. This is especially true for the averages of
different strength events which are made up of what are a very broad range
of conditions; some that are decidedly atypical.
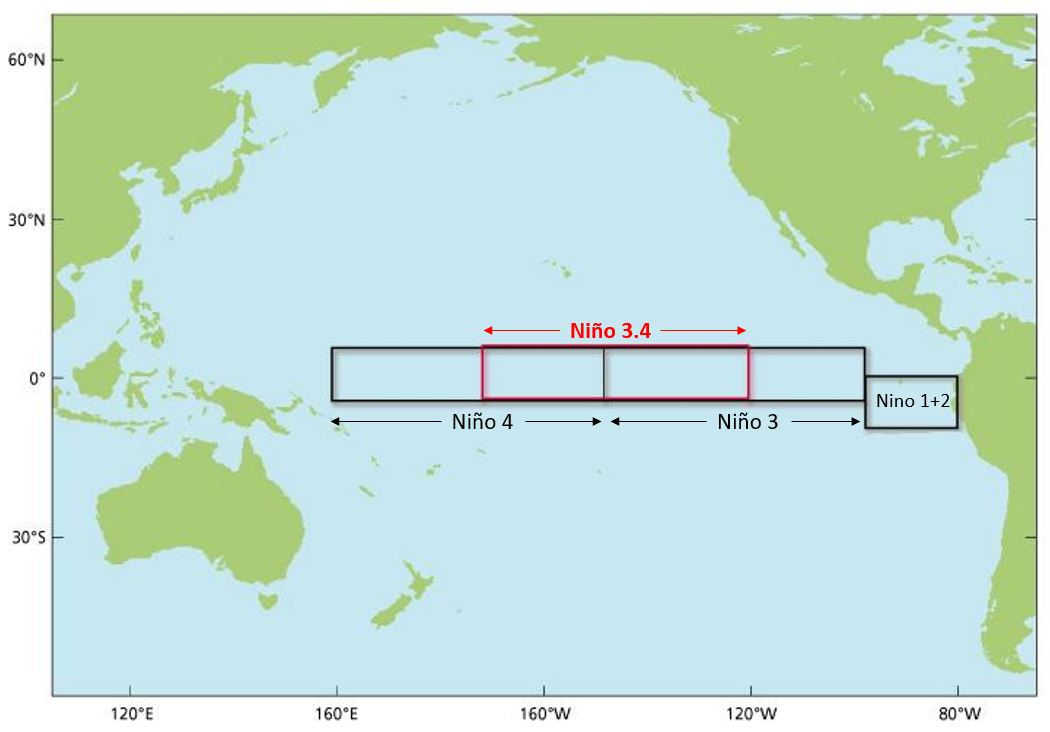
The
Oceanic Niño Index (ONI)
is used to identify El Niño (warm) and La Niña (cool) events in the
tropical Pacific. The ONI is the running 3-month mean SST anomaly for the
Niño 3.4 region (i.e.,
5°N-5°S, 120°-170°W).
Events are defined as 5 consecutive months at or above the +0.5° anomaly
for warm (El Niño) events and at or below the -0.5 anomaly for cold (La
Niña) events. The threshold is further broken down into Weak (with a 0.5°
to 0.9° SST anomaly), Moderate (1.0° to 1.4°), Strong (1.5° to 1.9°) and Very Strong (≥
2.0°) events. For
the purpose of this report for an event to be weak, moderate, strong or
very strong it
much have equaled or exceeded the threshold for at least 3 months.
El Niño Events:
Strong: 1957-1958, 1965-1966, 1972-1973, 1987-1988, 1991-1992
Very Strong:
1982-1983,
1997-1998, 2015-2016
|
Strong/Very Strong El NIño Events - Percent of Normal Seasonal
Precipitation (8 events) |
|
|
ENSO Type |
N Coast |
Sacramento |
N Lahontan |
SF Bay |
S Joaquin |
C Coast |
Tulare Lk |
S Lahontan |
S Coast |
Colo River |
CALIFORNIA |
|
|
Average % Normal |
114% |
115% |
105% |
125% |
116% |
135% |
128% |
139% |
142% |
143% |
120% |
|
|
Median % Normal |
105% |
109% |
110% |
120% |
112% |
124% |
121% |
128% |
129% |
131% |
109% |
|
|
|
|
|
|
|
|
|
|
|
|
|
|
|
Strong/Very Strong El NIño - Years by Percent of Normal
Categories (8 events) |
|
| % of
Normal |
N Coast |
Sacramento |
N Lahontan |
SF Bay |
S Joaquin |
C Coast |
Tulare Lk |
S Lahontan |
S Coast |
Colo River |
CALIFORNIA |
|
| <80% |
1 |
3 |
3 |
2 |
3 |
1 |
1 |
0 |
1 |
1 |
1 |
|
|
80-100% |
3 |
0 |
1 |
2 |
0 |
2 |
2 |
0 |
0 |
0 |
2 |
|
|
100-120% |
1 |
2 |
0 |
0 |
2 |
1 |
1 |
3 |
1 |
1 |
2 |
|
|
120-140% |
0 |
0 |
3 |
0 |
1 |
0 |
1 |
2 |
3 |
3 |
0 |
|
|
>140% |
3 |
3 |
1 |
4 |
2 |
4 |
3 |
3 |
3 |
3 |
3 |
|
|
|
|
|
|
|
|
|
|
|
|
|
|
|
Strong/Very Strong El NIño - Percent of Normal (8 events) |
|
| El
Niño Type |
Max ONI* |
N Coast |
Sacramento |
N Lahontan |
SF Bay |
S Joaquin |
C Coast |
Tulare Lk |
S Lahontan |
S Coast |
Colo River |
CALIFORNIA |
|
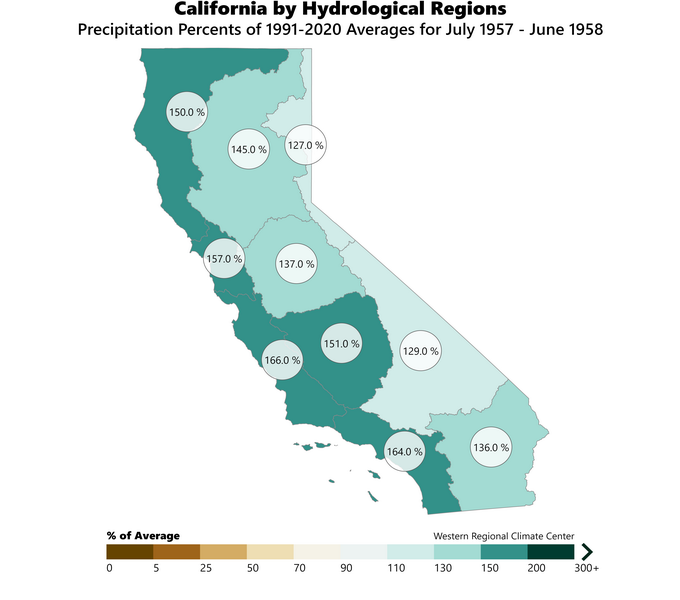
1957-1958 Strong |
+1.8 |
151% |
145% |
127% |
158% |
138% |
167% |
152% |
129% |
165% |
137% |
147% |
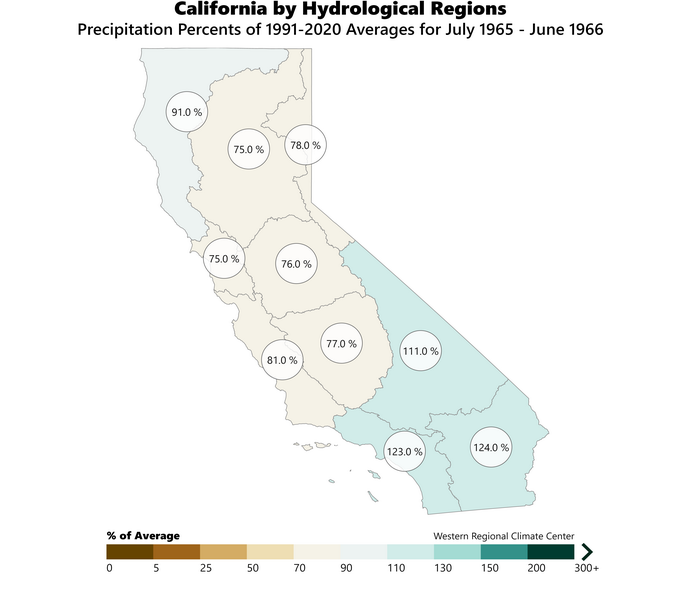
| 1965-1966
Strong |
+2.0 |
91% |
76% |
79% |
76% |
76% |
81% |
77% |
112% |
124% |
124% |
86% |
|
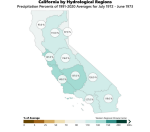
1972-1973 Strong |
+2.1 |
94% |
111% |
98% |
141% |
117% |
145% |
137% |
126% |
127% |
119% |
112% |
|
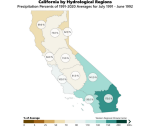
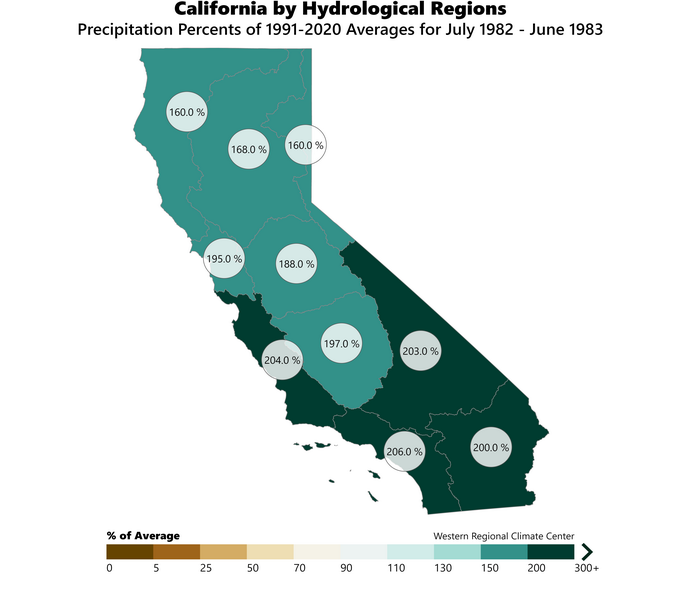
1982-1983 Very Strong |
+2.2 |
161% |
169% |
160% |
195% |
189% |
205% |
198% |
203% |
207% |
201% |
177% |
|
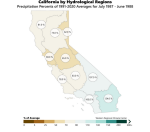
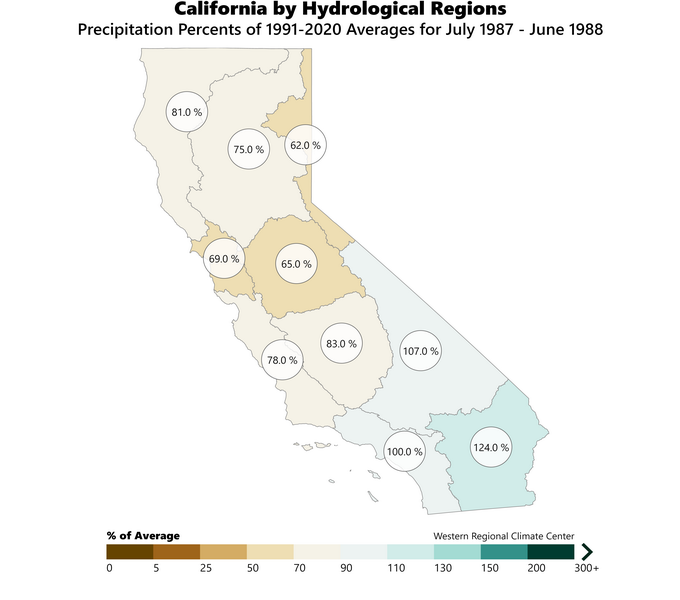
1987-1988 Strong |
+1.7 |
81% |
75% |
63% |
69% |
65% |
78% |
84% |
108% |
100% |
125% |
80% |
|
1991-1992 Strong |
+1.7 |
69% |
73% |
63% |
84% |
74% |
102% |
81% |
141% |
130% |
176% |
83% |
|
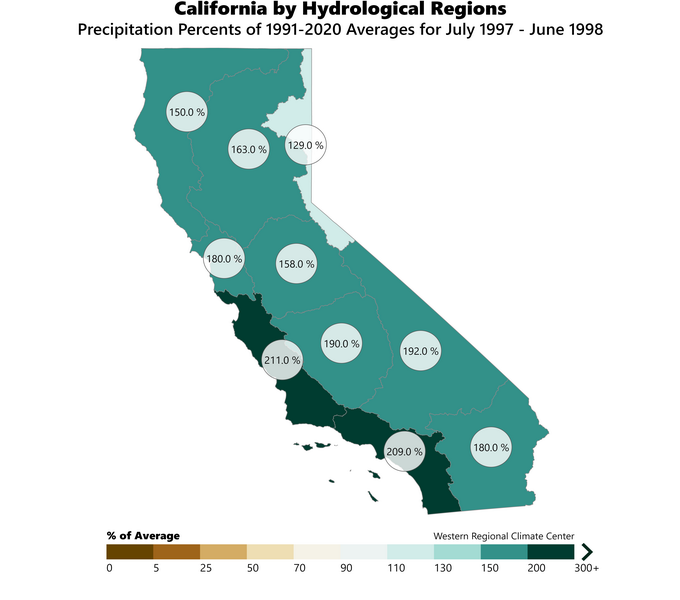
1997-1998 Very Strong |
+2.4 |
150% |
164% |
129% |
180% |
159% |
212% |
190% |
193% |
209% |
181% |
166% |
|
2015-2016 Very Strong |
+2.6 |
116% |
108% |
122% |
99% |
107% |
86% |
104% |
103% |
76% |
80% |
107% |
Average -
STRONG and VERY STRONG El Niño
ONI ≥
+1.5
 |
| 1957-58 |
1965-66 |
1972-73 |
1982-83 |
 |
 |
 |
 |
| 1987-88 |
1991-92 |
1997-98 |
2015-16 |
 |
 |
 |
 |
|
|
|
|


