Snapshot of the 2014-2015
California Rainfall Season

by Jan Null, CCM
Updated June 30,  2015

...NORTHERN CALIFORNIA... 2014-15 % Normal Normal
Crescent City 45.36 71% 64.03
Eureka 33.70 84% 40.33
Ukiah 26.56 71% 37.35
Redding 26.42 76% 34.62
Sacramento 15.88 86% 18.52
Santa Rosa 25.35 70% 36.28
San Francisco 18.19 77% 23.65
Oakland 15.02 72% 20.81
San Jose 13.72 92% 14.90
Nrn Sierra 8-Station Index (map) 38.48 71% 54.53
   
...CENTRAL CALIFORNIA... 2014-15 % Normal Normal
Stockton 11.30 80% 14.06
Modesto 10.55 80% 13.11
Fresno 6.60 57% 11.50
Bakersfield 5.30 82% 6.47
Salinas 9.92 77% 12.83
Paso Robles 8.81 69% 12.78
Santa Maria 7.64 55% 13.95
San Joaquin 5-Station Index (map) 18.88 44% 42.51
Tulare 6-Station Index (map) 13.01 43% 30.50
   
...SOUTHERN CALIFORNIA... 2014-15 % Normal Normal
Sandberg 7.56 61% 12.33
Palmdale 4.40 53% 8.30
Santa Barbara 9.64 54% 17.76
Los Angeles 8.51 57% 14.93
Irvine 6.88 52% 13.33
San Diego 9.03 87% 10.34
Ontario 10.12 67% 15.04
Riverside 6.12 49% 12.40
Palm Springs 3.40 59% 5.74
Campo 11.22 71% 15.73

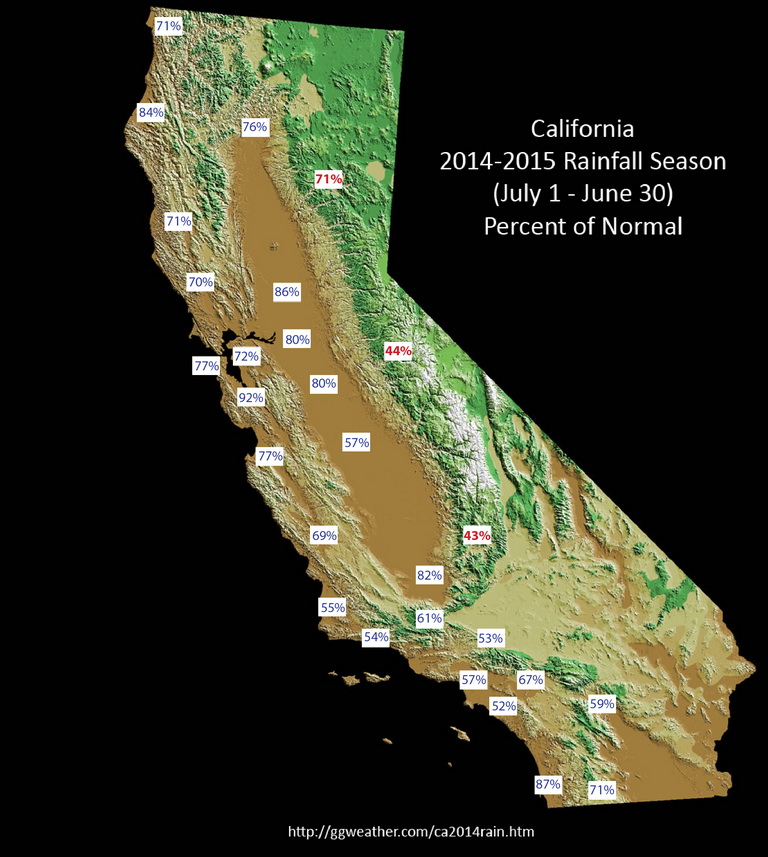
Notes:
- The averages for the three Sierra Nevada Indices (Northern Sierra, San Joaquin and Tulare) have been recalculated to correspond with the 1981-2010 normals used at the other sites.
- For the collective 4-year California rainfall deficits see: http://ggweather.com/4-year_deficit.htm.