| CAMELOT
CLIMATE INDEX based on 1981-2010 Normals |
 |
| CAMELOT
CLIMATE INDEX based on 1981-2010 Normals |
|
|
|
CAMELOT
It's
true! It's true!
A
law was made a distant moon ago here,
The
winter is forbidden till December...
I
know it sounds a bit bizarre.
The
rain may never fall till after sundown, ~Alan Jay Lerner (1960) |
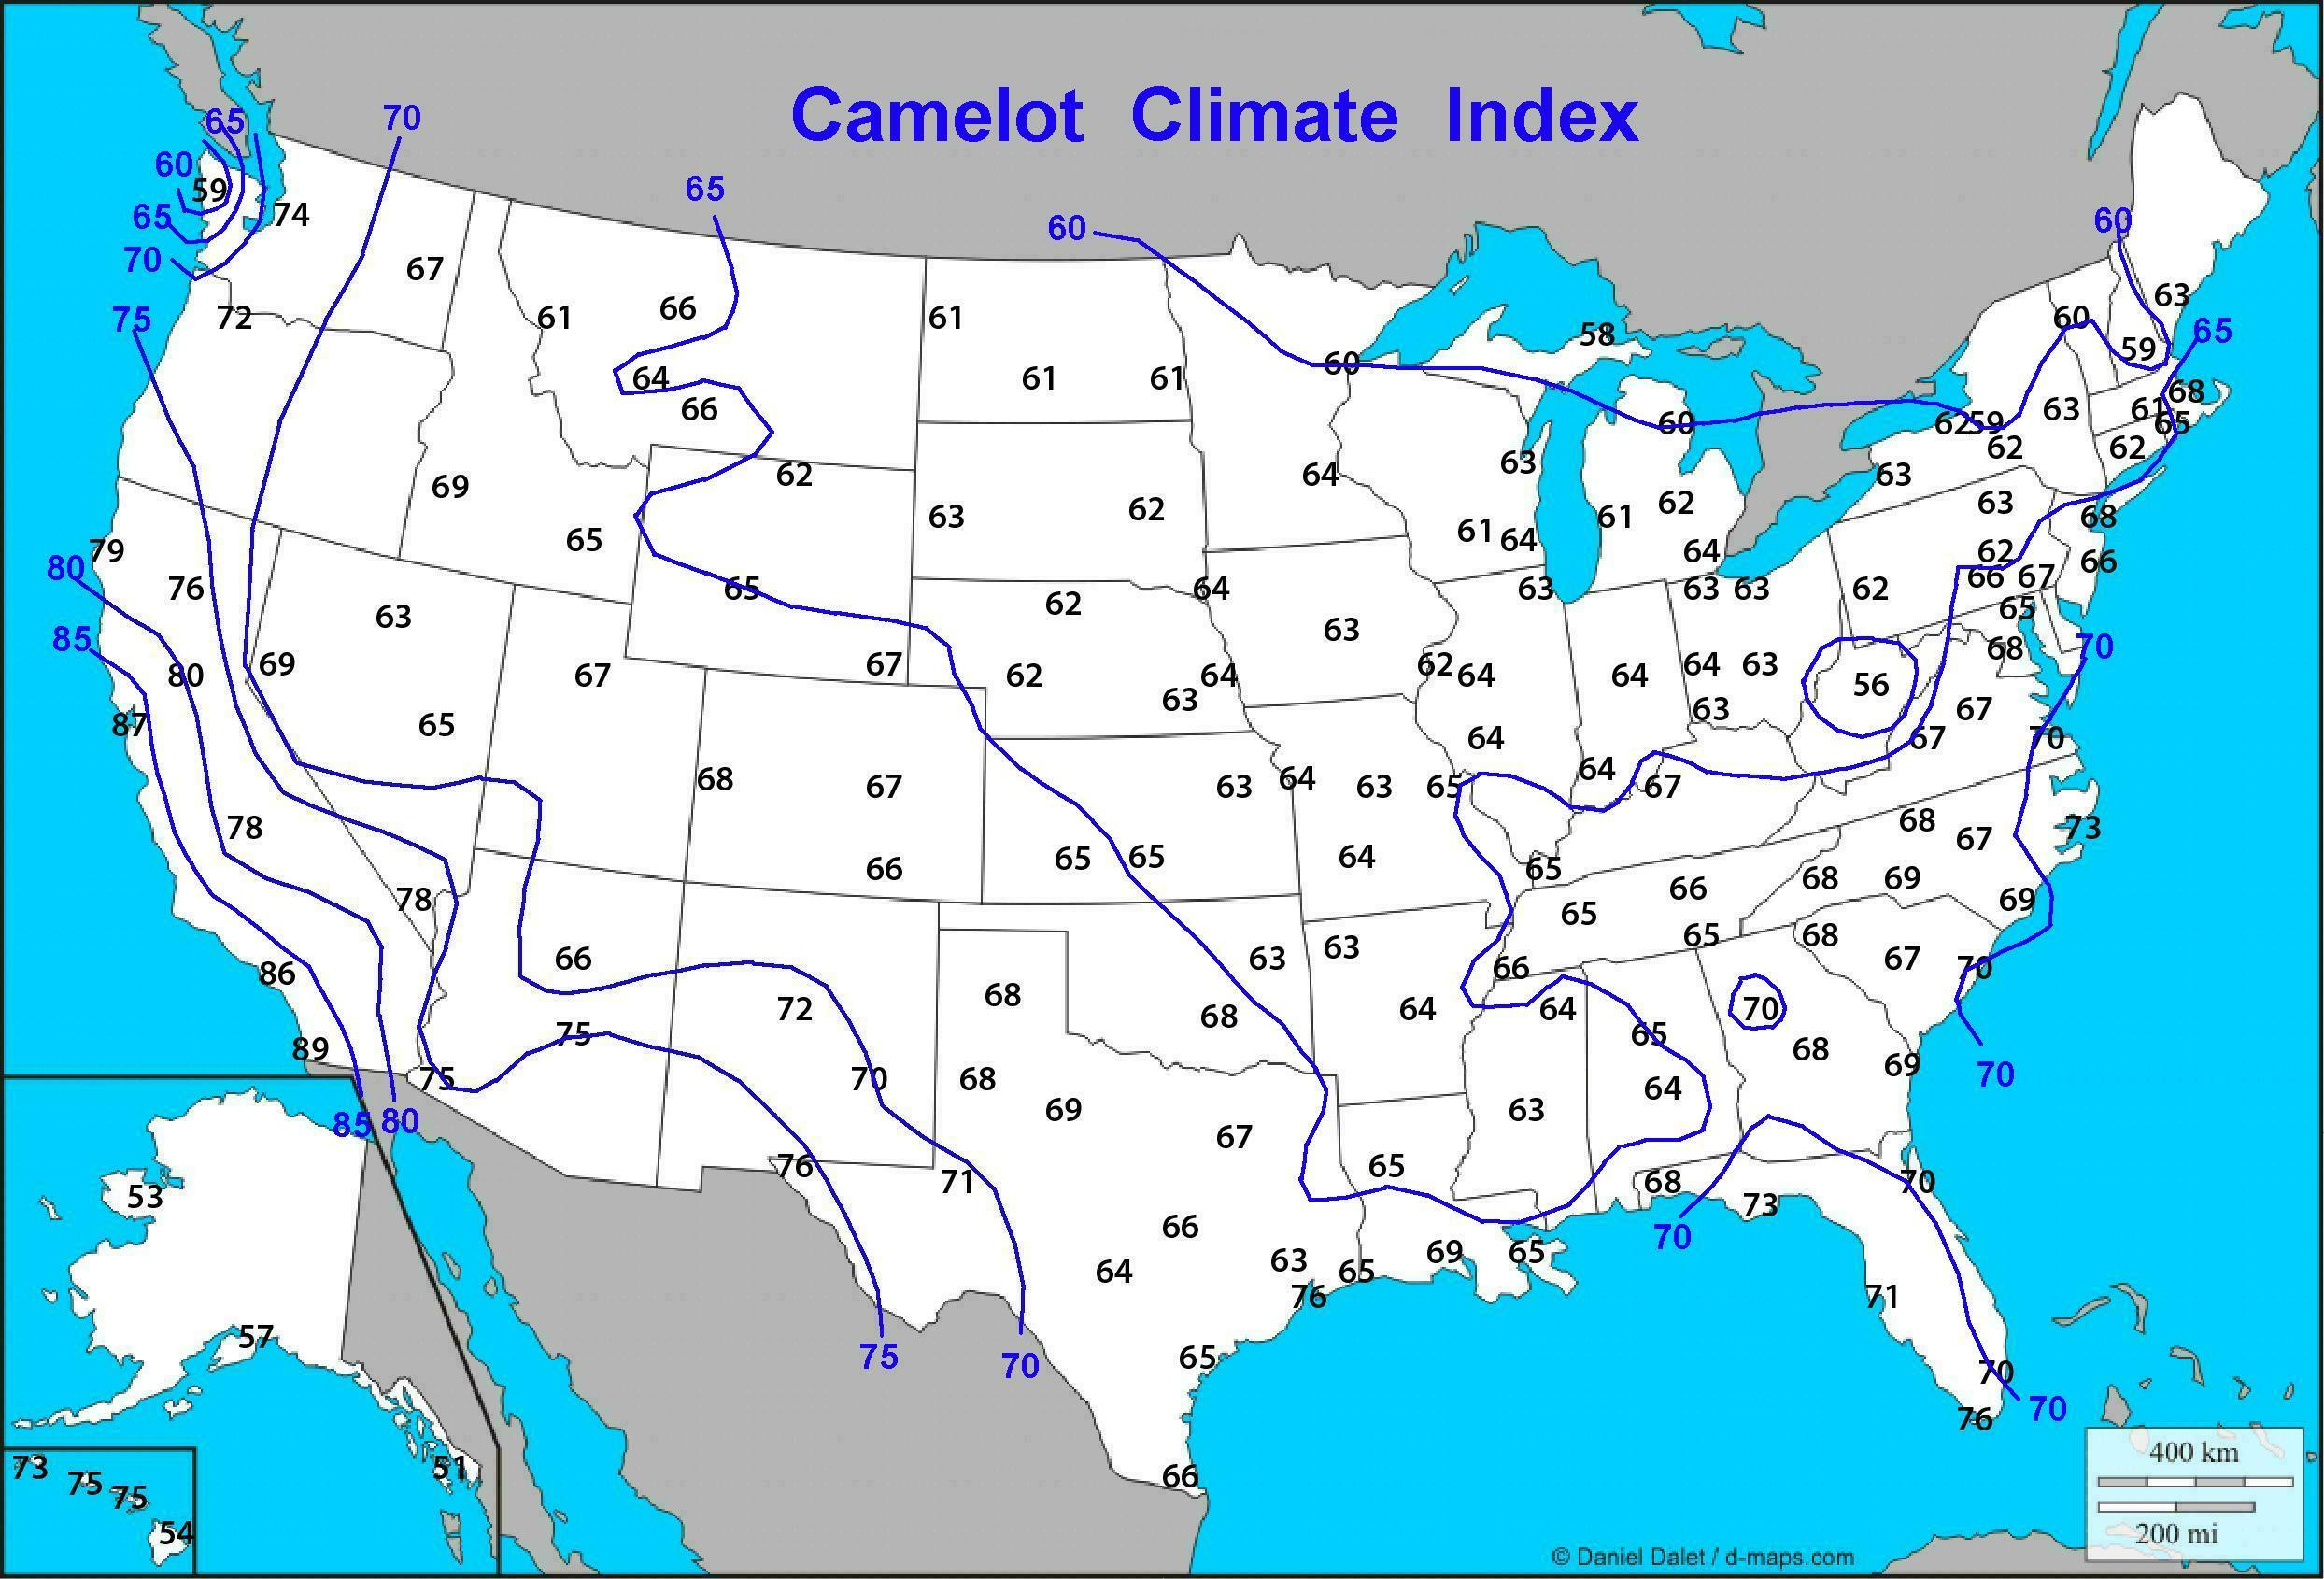
Camelot Climate Index (see description below)
| City | State | INDEX | MIN | >90 | <32 | PCPN | >.01 | SNOW | SUN | THI | |
| San Diego | CA | 89 | 0 | 3 | 0 | 11 | 37 | 0 | 68 | 0 | |
| San Francisco C.O. | CA | 87 | 0 | 2 | 0 | 22 | 67 | 0 | 66 | 0 | |
| Los Angeles C.O. | CA | 86 | 0 | 23 | 0 | 15 | 33 | 0 | 73 | 3 | |
| Sacramento | CA | 80 | 5 | 74 | 14 | 18 | 58 | 0 | 78 | 4 | |
| Eureka | CA | 79 | 6 | 0 | 4 | 38 | 114 | 0 | 51 | 0 | |
| Las Vegas | NV | 78 | 4 | 133 | 25 | 4 | 19 | 1 | 85 | 4 | |
| Fresno | CA | 78 | 5 | 109 | 17 | 11 | 43 | 0 | 79 | 4 | |
| Redding | CA | 76 | 8 | 98 | 28 | 34 | 76 | 4 | 88 | 4 | |
| Galveston | TX | 76 | 0 | 12 | 4 | 44 | 97 | 0 | 62 | 6 | |
| Key West | FL | 76 | 0 | 50 | 0 | 39 | 103 | 0 | 76 | 8 | |
| Tucson | AZ | 76 | 3 | 153 | 15 | 12 | 44 | 1 | 85 | 4 | |
| El Paso | TX | 76 | 9 | 102 | 57 | 9 | 42 | 6 | 84 | 4 | |
| Yuma | AZ | 75 | 0 | 176 | 2 | 3 | 16 | 0 | 90 | 8 | |
| Honolulu | HI | 75 | 0 | 34 | 0 | 18 | 89 | 0 | 71 | 12 | |
| Kahului | HI | 75 | 0 | 27 | 0 | 19 | 88 | 0 | 67 | 12 | |
| Phoenix | AZ | 75 | 2 | 184 | 4 | 8 | 28 | 0 | 85 | 5 | |
| Seattle Sea-Tac Ap | WA | 74 | 6 | 3 | 29 | 37 | 150 | 11 | 47 | 0 | |
| Apalachicola | FL | 73 | 1 | 27 | 6 | 57 | 105 | 0 | 67 | 7 | |
| Cape Hatteras | NC | 73 | 4 | 7 | 28 | 58 | 114 | 2 | 60 | 4 | |
| Lihue | HI | 73 | 0 | 0 | 0 | 40 | 193 | 0 | 59 | 9 | |
| Portland | OR | 72 | 10 | 13 | 39 | 37 | 147 | 7 | 48 | 0 | |
| Albuquerque | NM | 72 | 17 | 61 | 111 | 9 | 53 | 11 | 76 | 3 | |
| Tampa | FL | 71 | 0 | 87 | 2 | 45 | 100 | 0 | 66 | 6 | |
| Midland-Odessa | TX | 71 | 11 | 100 | 60 | 15 | 45 | 5 | 74 | 5 | |
| Norfolk | VA | 70 | 9 | 31 | 55 | 46 | 111 | 8 | 60 | 3 | |
| Atlanta | GA | 70 | 7 | 35 | 46 | 50 | 108 | 2 | 60 | 4 | |
| Miami | FL | 70 | 0 | 62 | 0 | 59 | 126 | 0 | 70 | 9 | |
| Roswell | NM | 70 | 14 | 95 | 85 | 13 | 48 | 12 | 74 | 4 | |
| Charleston Ap | SC | 70 | 3 | 57 | 32 | 52 | 106 | 1 | 63 | 5 | |
| Jacksonville | FL | 70 | 3 | 79 | 12 | 52 | 109 | 0 | 63 | 5 | |
| Abilene | TX | 69 | 9 | 93 | 53 | 24 | 59 | 5 | 71 | 6 | |
| Lake Charles | LA | 69 | 3 | 76 | 12 | 57 | 98 | 0 | 72 | 8 | |
| Reno | NV | 69 | 23 | 58 | 153 | 7 | 46 | 25 | 79 | 2 | |
| Savannah | GA | 69 | 3 | 69 | 28 | 50 | 105 | 0 | 62 | 5 | |
| Wilmington | NC | 69 | 4 | 44 | 44 | 57 | 111 | 2 | 63 | 5 | |
| Charlotte | NC | 69 | 11 | 43 | 62 | 44 | 104 | 6 | 62 | 4 | |
| Boise | ID | 69 | 17 | 48 | 119 | 12 | 82 | 21 | 64 | 2 | |
| New York C.Park | NY | 68 | 12 | 18 | 78 | 50 | 116 | 29 | 58 | 2 | |
| Grand Junction | CO | 68 | 17 | 63 | 137 | 9 | 65 | 24 | 71 | 2 | |
| Pensacola | FL | 68 | 2 | 67 | 14 | 64 | 104 | 0 | 60 | 5 | |
| Lubbock | TX | 68 | 13 | 82 | 91 | 19 | 57 | 10 | 72 | 5 | |
| Greensboro-Wnstn-Salm | NC | 68 | 11 | 31 | 80 | 43 | 110 | 9 | 60 | 3 | |
| Amarillo | TX | 68 | 17 | 65 | 113 | 20 | 64 | 17 | 73 | 4 | |
| Oklahoma City | OK | 68 | 11 | 68 | 70 | 36 | 77 | 10 | 68 | 5 | |
| Washington Nat'L Ap | DC | 68 | 11 | 39 | 66 | 39 | 105 | 20 | 56 | 3 | |
| Boston | MA | 68 | 14 | 13 | 92 | 43 | 120 | 43 | 58 | 2 | |
| Macon | GA | 68 | 7 | 80 | 46 | 45 | 102 | 1 | 66 | 5 | |
| Asheville | NC | 68 | 15 | 9 | 98 | 47 | 120 | 16 | 59 | 2 | |
| Greenville-Spartanburg | SC | 68 | 11 | 40 | 61 | 50 | 109 | 7 | 60 | 4 | |
| Salt Lake City | UT | 67 | 17 | 55 | 118 | 17 | 85 | 58 | 66 | 2 | |
| Philadelphia | PA | 67 | 12 | 24 | 90 | 42 | 111 | 22 | 56 | 2 | |
| Cheyenne | WY | 67 | 24 | 13 | 165 | 15 | 93 | 57 | 66 | 0 | |
| Richmond | VA | 67 | 11 | 46 | 84 | 44 | 108 | 14 | 63 | 3 | |
| Spokane | WA | 67 | 18 | 20 | 133 | 17 | 107 | 49 | 55 | 0 | |
| Columbia | SC | 67 | 7 | 71 | 53 | 48 | 103 | 2 | 64 | 5 | |
| Denver | CO | 67 | 20 | 33 | 152 | 16 | 82 | 60 | 69 | 2 | |
| Lynchburg | VA | 67 | 15 | 24 | 94 | 43 | 111 | 19 | 59 | 3 | |
| Raleigh | NC | 67 | 11 | 42 | 73 | 43 | 109 | 8 | 58 | 4 | |
| Knoxville | TN | 66 | 11 | 29 | 72 | 48 | 121 | 12 | 56 | 4 | |
| Dallas-Fort Worth | TX | 66 | 5 | 98 | 37 | 35 | 72 | 3 | 61 | 7 | |
| Louisville | KY | 66 | 11 | 31 | 85 | 45 | 118 | 17 | 56 | 3 | |
| Atlantic City Ap | NJ | 66 | 15 | 18 | 111 | 41 | 107 | 17 | 56 | 2 | |
| Pueblo | CO | 66 | 21 | 72 | 158 | 12 | 65 | 32 | 76 | 2 | |
| Austin/City | TX | 66 | 3 | 109 | 16 | 34 | 78 | 1 | 60 | 8 | |
| Flagstaff | AZ | 66 | 26 | 6 | 210 | 23 | 78 | 101 | 78 | 0 | |
| Memphis | TN | 66 | 9 | 66 | 56 | 55 | 99 | 5 | 64 | 5 | |
| Billings | MT | 66 | 20 | 31 | 146 | 15 | 92 | 57 | 60 | 1 | |
| Harrisburg | PA | 66 | 15 | 23 | 106 | 41 | 126 | 34 | 58 | 2 | |
| Brownsville | TX | 66 | 0 | 136 | 3 | 28 | 66 | 0 | 60 | 9 | |
| Great Falls | MT | 66 | 25 | 20 | 163 | 15 | 96 | 60 | 61 | 0 | |
| Shreveport | LA | 65 | 3 | 89 | 36 | 51 | 92 | 2 | 63 | 7 | |
| Corpus Christi | TX | 65 | 0 | 118 | 6 | 32 | 72 | 0 | 60 | 10 | |
| Providence | RI | 65 | 15 | 11 | 118 | 46 | 118 | 36 | 58 | 2 | |
| Dodge City | KS | 65 | 17 | 68 | 127 | 22 | 72 | 20 | 70 | 4 | |
| Ely | NV | 65 | 28 | 19 | 218 | 10 | 68 | 51 | 73 | 0 | |
| Birmingham Ap | AL | 65 | 7 | 60 | 53 | 54 | 111 | 2 | 58 | 5 | |
| Concordia | KS | 65 | 17 | 49 | 126 | 28 | 83 | 22 | 67 | 4 | |
| Lander | WY | 65 | 26 | 21 | 186 | 13 | 66 | 101 | 68 | 0 | |
| Nashville | TN | 65 | 11 | 49 | 69 | 48 | 112 | 10 | 56 | 4 | |
| New Orleans | LA | 65 | 1 | 73 | 10 | 64 | 107 | 0 | 57 | 8 | |
| Fort Wayne | IN | 65 | 17 | 12 | 126 | 37 | 126 | 33 | 59 | 3 | |
| Wichita | KS | 65 | 16 | 63 | 109 | 30 | 80 | 16 | 65 | 4 | |
| Paducah | KY | 65 | 11 | 47 | 82 | 49 | 103 | 11 | 58 | 4 | |
| Baltimore | MD | 65 | 17 | 33 | 98 | 42 | 107 | 22 | 57 | 3 | |
| St. Louis | MO | 65 | 11 | 44 | 94 | 39 | 105 | 20 | 57 | 4 | |
| Pocatello | ID | 65 | 23 | 35 | 170 | 13 | 88 | 42 | 64 | 1 | |
| Chattanooga | TN | 65 | 11 | 53 | 66 | 55 | 113 | 4 | 57 | 4 | |
| Port Arthur | TX | 65 | 2 | 83 | 13 | 60 | 97 | 0 | 58 | 8 | |
| Springfield | IL | 64 | 17 | 31 | 117 | 36 | 107 | 23 | 59 | 3 | |
| Omaha (North) | NE | 64 | 18 | 24 | 136 | 30 | 102 | 31 | 60 | 3 | |
| Helena | MT | 64 | 25 | 20 | 180 | 11 | 89 | 46 | 59 | 0 | |
| Dayton | OH | 64 | 17 | 15 | 118 | 40 | 126 | 28 | 53 | 2 | |
| Little Rock | AR | 64 | 11 | 72 | 58 | 51 | 99 | 5 | 62 | 6 | |
| Montgomery | AL | 64 | 4 | 76 | 40 | 55 | 100 | 0 | 59 | 7 | |
| Sioux City | IA | 64 | 19 | 25 | 146 | 26 | 94 | 33 | 61 | 3 | |
| Evansville | IN | 64 | 13 | 45 | 97 | 44 | 110 | 14 | 59 | 4 | |
| Kansas City | MO | 64 | 16 | 41 | 110 | 38 | 97 | 20 | 60 | 4 | |
| Indianapolis | IN | 64 | 17 | 14 | 116 | 41 | 120 | 25 | 55 | 3 | |
| San Antonio | TX | 64 | 3 | 120 | 21 | 33 | 76 | 1 | 60 | 9 | |
| Milwaukee | WI | 64 | 18 | 9 | 131 | 35 | 119 | 49 | 54 | 2 | |
| Springfield | MO | 64 | 14 | 44 | 100 | 45 | 105 | 18 | 60 | 4 | |
| Detroit | MI | 64 | 17 | 13 | 129 | 33 | 128 | 43 | 53 | 2 | |
| Minneapolis-St.Paul | MN | 64 | 20 | 14 | 148 | 29 | 108 | 50 | 58 | 2 | |
| Tupelo | MS | 64 | 11 | 72 | 53 | 56 | 104 | 3 | 64 | 7 | |
| Peoria | IL | 64 | 18 | 22 | 127 | 36 | 108 | 26 | 56 | 3 | |
| Lincoln | NE | 63 | 18 | 43 | 139 | 28 | 87 | 29 | 61 | 3 | |
| Des Moines | IA | 63 | 18 | 24 | 137 | 35 | 102 | 35 | 59 | 3 | |
| Cleveland | OH | 63 | 17 | 9 | 118 | 39 | 152 | 60 | 49 | 1 | |
| Chicago | IL | 63 | 18 | 19 | 127 | 36 | 119 | 39 | 54 | 2 | |
| Jackson | MS | 63 | 6 | 81 | 49 | 56 | 102 | 1 | 61 | 7 | |
| Fort Smith | AR | 63 | 11 | 71 | 68 | 44 | 91 | 6 | 61 | 7 | |
| Avoca | PA | 63 | 17 | 10 | 123 | 38 | 134 | 48 | 51 | 2 | |
| Columbus | OH | 63 | 17 | 13 | 110 | 39 | 132 | 29 | 50 | 3 | |
| Tulsa | OK | 63 | 11 | 72 | 72 | 42 | 85 | 13 | 62 | 7 | |
| Toledo | OH | 63 | 17 | 13 | 135 | 33 | 129 | 38 | 52 | 2 | |
| Topeka | KS | 63 | 17 | 48 | 119 | 36 | 91 | 21 | 61 | 4 | |
| Portland | ME | 63 | 21 | 5 | 149 | 46 | 123 | 71 | 57 | 0 | |
| Rapid City | SD | 63 | 24 | 36 | 171 | 17 | 89 | 41 | 63 | 2 | |
| Greater Cincinnati Ap | OH | 63 | 15 | 20 | 108 | 43 | 125 | 24 | 50 | 3 | |
| Green Bay | WI | 63 | 23 | 7 | 156 | 29 | 116 | 50 | 54 | 1 | |
| Houston | TX | 63 | 3 | 100 | 17 | 48 | 98 | 0 | 59 | 10 | |
| Albany | NY | 63 | 18 | 10 | 139 | 39 | 130 | 64 | 53 | 1 | |
| Buffalo | NY | 63 | 17 | 4 | 126 | 41 | 163 | 94 | 48 | 0 | |
| Columbia | MO | 63 | 17 | 39 | 106 | 40 | 106 | 23 | 56 | 4 | |
| Winnemucca | NV | 63 | 23 | 64 | 186 | 8 | 64 | 24 | 68 | 2 | |
| Rochester | NY | 62 | 17 | 9 | 131 | 34 | 156 | 94 | 51 | 1 | |
| North Platte | NE | 62 | 24 | 40 | 175 | 20 | 77 | 31 | 67 | 3 | |
| Allentown | PA | 62 | 17 | 17 | 127 | 45 | 119 | 33 | 53 | 2 | |
| Hartford | CT | 62 | 17 | 19 | 130 | 46 | 122 | 50 | 56 | 2 | |
| Pittsburgh | PA | 62 | 17 | 9 | 115 | 38 | 145 | 44 | 45 | 2 | |
| Lansing | MI | 62 | 21 | 9 | 148 | 32 | 133 | 49 | 51 | 1 | |
| Moline | IL | 62 | 18 | 26 | 131 | 38 | 108 | 32 | 55 | 3 | |
| Huron | SD | 62 | 24 | 31 | 169 | 21 | 86 | 41 | 63 | 3 | |
| Valentine | NE | 62 | 25 | 40 | 175 | 20 | 78 | 33 | 65 | 3 | |
| Binghamton | NY | 62 | 18 | 3 | 142 | 39 | 156 | 85 | 49 | 0 | |
| Sheridan | WY | 62 | 26 | 31 | 190 | 15 | 99 | 71 | 63 | 1 | |
| Blue Hill | MA | 61 | 17 | 8 | 137 | 51 | 128 | 61 | 52 | 1 | |
| Madison | WI | 61 | 19 | 13 | 158 | 33 | 115 | 51 | 54 | 2 | |
| Fargo | ND | 61 | 24 | 15 | 180 | 21 | 97 | 42 | 57 | 2 | |
| Missoula | MT | 61 | 23 | 21 | 193 | 14 | 117 | 46 | 55 | 0 | |
| Williston | ND | 61 | 27 | 25 | 191 | 14 | 89 | 43 | 61 | 2 | |
| Bismarck | ND | 61 | 26 | 24 | 188 | 17 | 90 | 45 | 59 | 2 | |
| Grand Rapids | MI | 61 | 17 | 10 | 140 | 37 | 139 | 75 | 46 | 1 | |
| Burlington | VT | 60 | 21 | 6 | 149 | 36 | 149 | 80 | 49 | 1 | |
| Alpena | MI | 60 | 22 | 7 | 173 | 28 | 139 | 85 | 48 | 0 | |
| Duluth | MN | 60 | 26 | 3 | 184 | 31 | 128 | 82 | 52 | 0 | |
| Concord | NH | 59 | 22 | 14 | 174 | 38 | 122 | 65 | 54 | 1 | |
| Syracuse | NY | 59 | 20 | 10 | 133 | 40 | 165 | 119 | 46 | 1 | |
| Quillayute | WA | 59 | 12 | 0 | 62 | 102 | 202 | 13 | 33 | 0 | |
| Sault Ste. Marie | MI | 58 | 24 | 3 | 174 | 35 | 160 | 117 | 47 | 0 | |
| Anchorage | AK | 57 | 26 | 15 | 188 | 16 | 107 | 73 | 41 | 0 | |
| Elkins | WV | 56 | 20 | 3 | 146 | 46 | 164 | 78 | 40 | 2 | |
| Hilo | HI | 54 | 0 | 0 | 0 | 126 | 271 | 0 | 41 | 12 | |
| Nome | AK | 53 | 32 | 7 | 236 | 17 | 124 | 66 | 42 | 0 | |
| Juneau | AK | 51 | 21 | 26 | 139 | 58 | 218 | 99 | 30 | 0 | |
| Mt. Washington | NH | 36 | 35 | 0 | 236 | 102 | 204 | 260 | 33 | 0 |
|
In this 1960's musical King Arthur professes that Camelot has a perfect climate all the year; and by royal decree at that! But actually an "ideal" climate is extremely subjective, with one person's idea of perfection being met with disdain by others. Some individuals may want warm beach weather all year round, while four distinct seasons are most desirable for others. What follows is just one person's (the author's) idea that an ideal climate is sunny and relatively mild with few extremes in temperature, humidity or precipitation. Dataset The initial Comparative Climatic Data (CCC) analyzed has approximately 300 locations from all fifty states, Puerto Rico and 10 Pacific island stations. This represents ninety major urban areas by stations within thirty miles. Unfortunately, not all of the meteorological parameters are available for all of the stations. In particular, some stations do not regularly record relative humidity and sunshine. The most limiting factor was the lack of data for the percent of possible sunshine data, with only 158 stations having all the requisite parameters.
Maximum Temperature Minimum Temperature Precipitation Data Sunshine Data Index Calculation The maximum value for each category was used to set the "best possible" for that category. This was divided by the weight given that parameter to derive an overall rating factor. For example: the highest value of MAX90 was 170 days (at Yuma, AZ), and MAX90 has a weight of 15%, giving a weighting factor of 11.3, which is expressed as MAX90wf. The only exception to this was with the sunshine data, where the "ideal" condition would be 100% sunshine, thus the percent of sunshine received is subtracted from 100 initially, then divided by the given weight. The total CCI for each station was derived by subtracting the weighted value for each parameter from a value of 100, which would be "perfect" weather. It takes the form:
Conclusions And remember the primary assumptions for this study are based upon a 1960's musical about a mythical land with a mild dry "perfect" climate as expressed by mythical King Arthur! Consequently, cities with dry, mild and temperate climates ended up at the top of the Camelot Climate Indices. If a similar project was done by a storm chaser it might be called the Oz Climate Index with a bias towards the number of thunderstorm days, hail and tornadoes. |
Copyright © 2012, Golden Gate Weather Services.
Reproduction in full or part is prohibited without
permission.